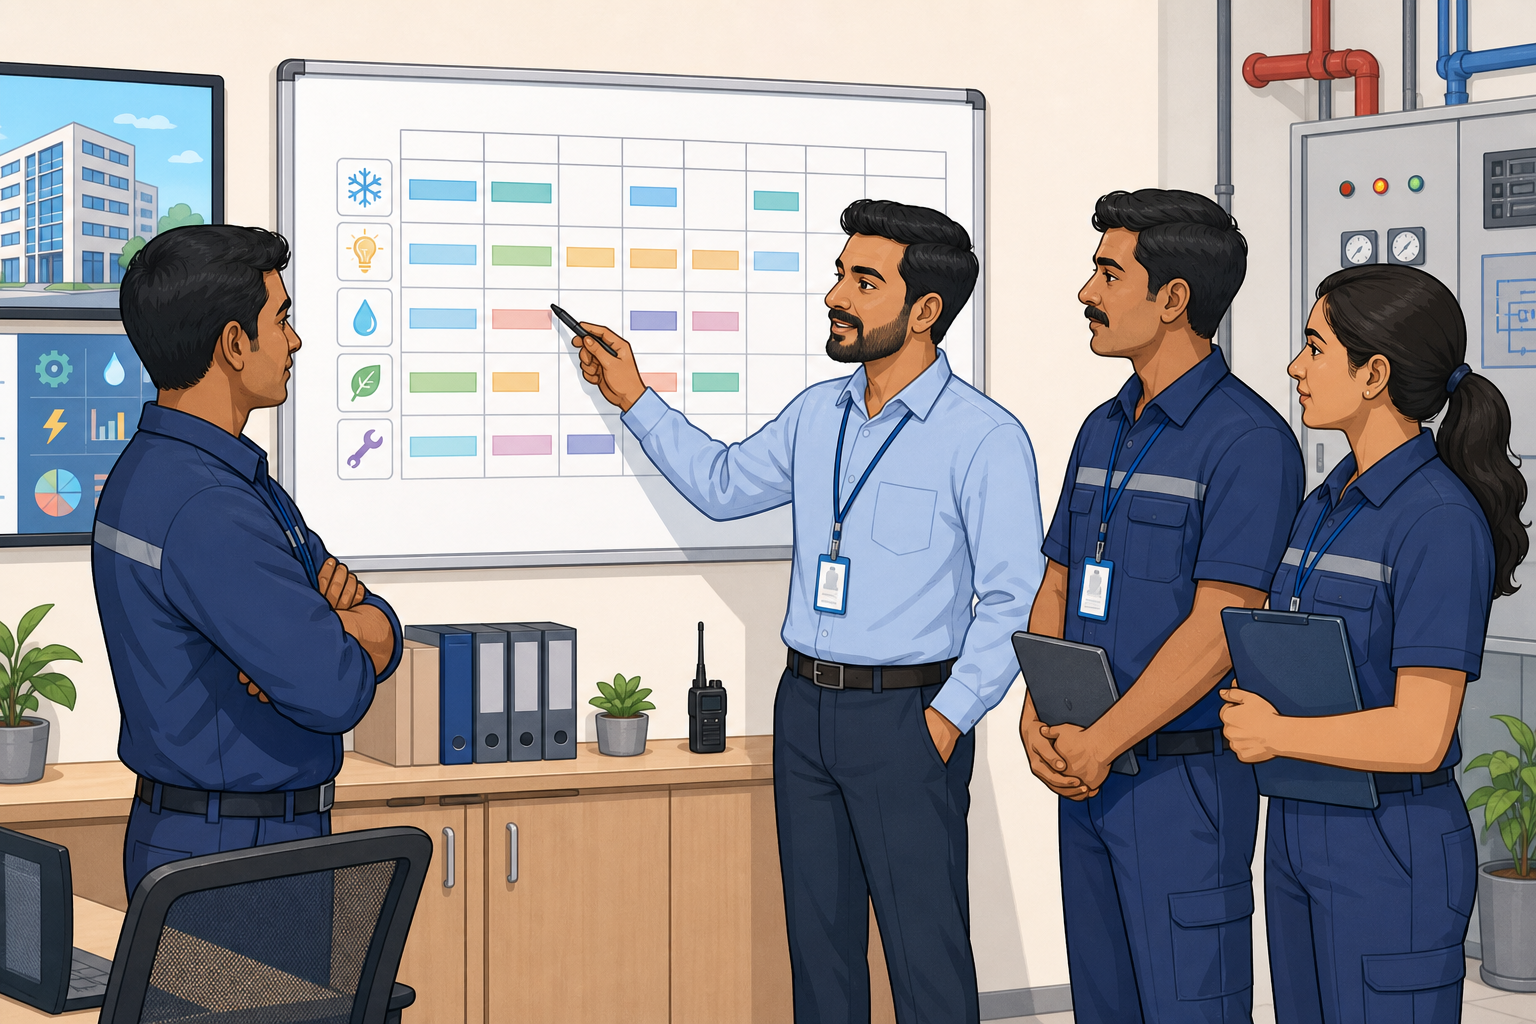
What Professional FM Operations Looks Like
Professional facility management is not just about keeping things running — it is a systematic practice of maintaining building performance, managing risk, controlling cost, and ensuring occupant satisfaction. The difference between amateur and professional FM is not capability — it is systems, documentation, and measurement.
Maintenance Strategy
The Four Maintenance Approaches
| Approach | Description | When to Use | Cost Profile |
|---|---|---|---|
| Reactive | Fix when broken | Non-critical items, cosmetic | Low initial, high lifecycle |
| Preventive (PPM) | Scheduled service regardless of condition | Most MEP equipment, safety systems | Moderate, predictable |
| Condition-Based | Monitor condition, act on triggers | High-value equipment, rotating machinery | Higher monitoring cost, lower intervention cost |
| Predictive | Use data/analytics to predict failure | Critical equipment with failure consequence | Highest initial, lowest lifecycle |
PPM Calendar: Key Equipment
| System | Monthly | Quarterly | Semi-Annual | Annual |
|---|---|---|---|---|
| HVAC — Chillers | Condenser cleaning, log readings | Refrigerant check, oil analysis | Tube cleaning, vibration analysis | Comprehensive overhaul, performance test |
| HVAC — AHUs | Filter check, belt tension | Filter replacement, coil cleaning | Motor bearing, damper check | Full service, TAB verification |
| Electrical — Panels | Visual inspection | Torque check (IR scan annually) | — | Thermographic survey, earth test |
| Generator | No-load test run (15 min) | ATS transfer test | — | Full load bank test |
| Fire — Detection | Zone test (rotate) | 25% detectors tested | 50% tested | 100% tested, panel serviced |
| Fire — Sprinkler | Visual valve check | Alarm valve trip test | — | Full flow test, pump test |
| Lifts | Car top, pit inspection | Door timing, levelling | — | Comprehensive safety inspection |
| Plumbing | Tank inspection | Water quality test | — | Tank cleaning, pipe inspection |
FM KPIs That Matter
| KPI | Formula / Measure | Target | Red Flag |
|---|---|---|---|
| PPM Compliance | Completed PPM / Scheduled PPM × 100 | ≥95% | <80% |
| Reactive:Planned Ratio | Reactive WO / Total WO × 100 | ≤20% reactive | >50% reactive |
| MTTR | Total downtime / Number of failures | <4 hours (critical) | >24 hours |
| EUI | Total energy (kWh) / GFA (m²) / year | 100-150 (office) | >300 |
| Occupancy Cost | Total cost / GFA (m²) / year | Market benchmark ±10% | >30% above benchmark |
| Lift Availability | Uptime / Total time × 100 | ≥98% | <95% |
| WO Response Time | Time from report to first action | ≤1 hour (urgent), ≤4 hours (routine) | >24 hours (routine) |
| Customer Satisfaction | Quarterly survey score | ≥4.0/5.0 | <3.0/5.0 |
Vendor Management
Contract Types
| Type | Scope | Best For | Risk |
|---|---|---|---|
| Comprehensive AMC | All parts + labour | Lifts, chillers, fire systems | Low risk — vendor owns performance |
| Non-Comprehensive AMC | Labour only, parts billed separately | General MEP, HVAC | Medium — parts cost unpredictable |
| Call-Out | On-demand service | Infrequent/specialist needs | High — no SLA, unpredictable cost |
| IFM/TFM | Integrated/Total FM outsource | Large portfolios, >10,000 m² | Low risk — single point of accountability |
Vendor SLA Essentials
- Response time: Emergency ≤30 min, Urgent ≤2 hours, Routine ≤24 hours
- Resolution time: Emergency ≤4 hours, Urgent ≤8 hours, Routine ≤48 hours
- PPM schedule: Detailed tasks per visit, completion evidence (photos, readings)
- Penalties: Deductions for missed SLAs (typically 2-5% of monthly fee per breach, capped at 15-20%)
- Reporting: Monthly report with KPIs, PPM completion, WO summary, recommendations
Energy Management
| Quick Win | Savings | Investment | Payback |
|---|---|---|---|
| LED lighting retrofit | 40-60% lighting energy | Moderate | 1-3 years |
| BMS scheduling optimisation | 10-20% HVAC energy | Low (software) | <6 months |
| Chiller plant optimisation | 15-25% chiller energy | Low-Moderate | 1-2 years |
| Variable speed drives (VSD) | 20-40% pump/fan energy | Moderate | 1-3 years |
| Roof insulation | 5-15% cooling load | Moderate | 3-5 years |
| Sub-metering + monitoring | 5-10% total (behavioural) | Moderate | 1-2 years |
Compliance Management
Professional FM requires a compliance calendar — every permit, licence, and certificate tracked with renewal dates, responsible persons, and lead times.
| Document | Authority | Renewal | Lead Time |
|---|---|---|---|
| Fire Licence | FSCD | Annual | 2-3 months |
| Trade Licence | City Corporation | Annual | 1-2 months |
| Environmental Clearance | DoE | As per category | 3-6 months |
| Lift Registration | Chief Inspector of Boilers | Annual | 1-2 months |
| Electrical Safety Certificate | Licensed contractor | Annual test | 2-4 weeks |
| Generator Emission Test | DoE | Annual | 2-4 weeks |
| Water Quality Test | ICDDR,B or BUET lab | Quarterly-Annual | 1-2 weeks |
FM Budgeting
| Cost Category | % of Total | Benchmark (BDT/m²/yr) |
|---|---|---|
| Utilities (electricity, water, gas) | 35-45% | 2,000-4,000 |
| Maintenance (PPM + reactive) | 15-25% | 800-2,000 |
| Cleaning & hygiene | 10-15% | 400-800 |
| Security | 10-15% | 400-800 |
| CAPEX reserve | 5-10% | 500-1,500 |
| Management & admin | 5-10% | 300-600 |
References
- IFMA — International Facility Management Association
- RICS — FM Service Delivery Standards
- BICS — British Institute of Cleaning Science
- ISO 41001 — Facility Management Standard
- ISO 55001 — Asset Management
- ASHRAE — HVAC Maintenance and Operation
- NFPA 25 — Inspection, Testing, and Maintenance of Fire Protection
- CIBSE — Building Services Engineering Guides
Insights & Guidance
- Professional FM = systems + documentation + measurement. The difference is not capability — it is discipline.
- Target ≥95% PPM compliance and ≤20% reactive work orders. If >50% of your work is reactive, you don't have a maintenance programme.
- Every building needs a compliance calendar — permits, licences, certificates — tracked with renewal dates and lead times.
- Energy management quick wins (LED, BMS optimisation, VSD) typically deliver 15-25% savings with 1-3 year payback.
- Vendor SLAs must include response times, resolution times, PPM evidence, penalties, and monthly reporting.
- FM budgeting: utilities are 35-45% of total cost — this is where the biggest savings opportunity lies.
FM operations directly affect building safety, occupant comfort, energy cost, asset value, and regulatory compliance. A building without professional FM deteriorates faster, costs more to operate, exposes the organisation to safety risk, and eventually becomes a liability rather than an asset. This guide provides the reference framework for systematic FM operations.
- Reactive trap — when most work is unplanned, costs spiral and reliability collapses.
- Compliance gaps — expired permits, untested safety systems, lapsed certificates.
- Vendor dependency — no SLAs, no performance measurement, vendor controls the relationship.
- PPM schedule with completion records
- Work order log with response/resolution times
- Compliance calendar with current status
- Vendor contracts with SLAs
- Energy consumption reports (monthly)
- FM KPI dashboard (monthly)
- Plant rooms: clean, labelled, maintained, or neglected?
- Are PPM stickers/tags visible on equipment with dates?
- Is there a BMS and is it being monitored?
- What is the PPM compliance rate? Can I see the PPM log?
- What percentage of work orders are reactive vs planned?
- What FM KPIs are tracked and reported monthly?
- FM strategy — ISO 41001-aligned FM consultant for system design.
- Energy audit — ASHRAE Level II audit by certified energy auditor (BEAP).
- Asset assessment — building surveyor or MEP specialist for condition assessment and lifecycle planning.